Collateral Risk Monitoring Framework
End-to-end collateral risk monitoring framework combining Python, Power BI, stress testing, anomaly detection, concentration risk analysis, and automated reporting.
This framework uses synthetic data for demonstration purposes. The complete Power BI report, including DAX measures and the underlying data model, is available upon request.
Business Problem
Central banks and financial institutions need to continuously monitor collateral adequacy, identify emerging risks, assess concentration exposures, and evaluate the impact of adverse market events. This project was designed to simulate an integrated collateral risk monitoring framework capable of supporting risk analysts through stress testing, anomaly detection, early warning monitoring, and executive reporting.
Solution Architecture
- Synthetic collateral portfolio generation
- Counterparty risk monitoring engine
- Market stress testing engine
- Concentration risk analysis module
- Issuer stress testing module
- ML anomaly detection engine
- Early warning system
- Executive reporting engine
- Power BI visualization layer
Technology Stack
Power BI Dashboard
Dashboard pages covering portfolio-level monitoring, market stress testing, concentration risk, issuer stress testing, anomaly detection, early warning indicators, trend analysis, and management action recommendations.
Executive Monitoring Report
Automatically generated using Python-based reporting rules from synthetic portfolio data. This report was not manually prepared.
COLLATERAL RISK MONITORING REPORT
Generated on: 2026-06-08
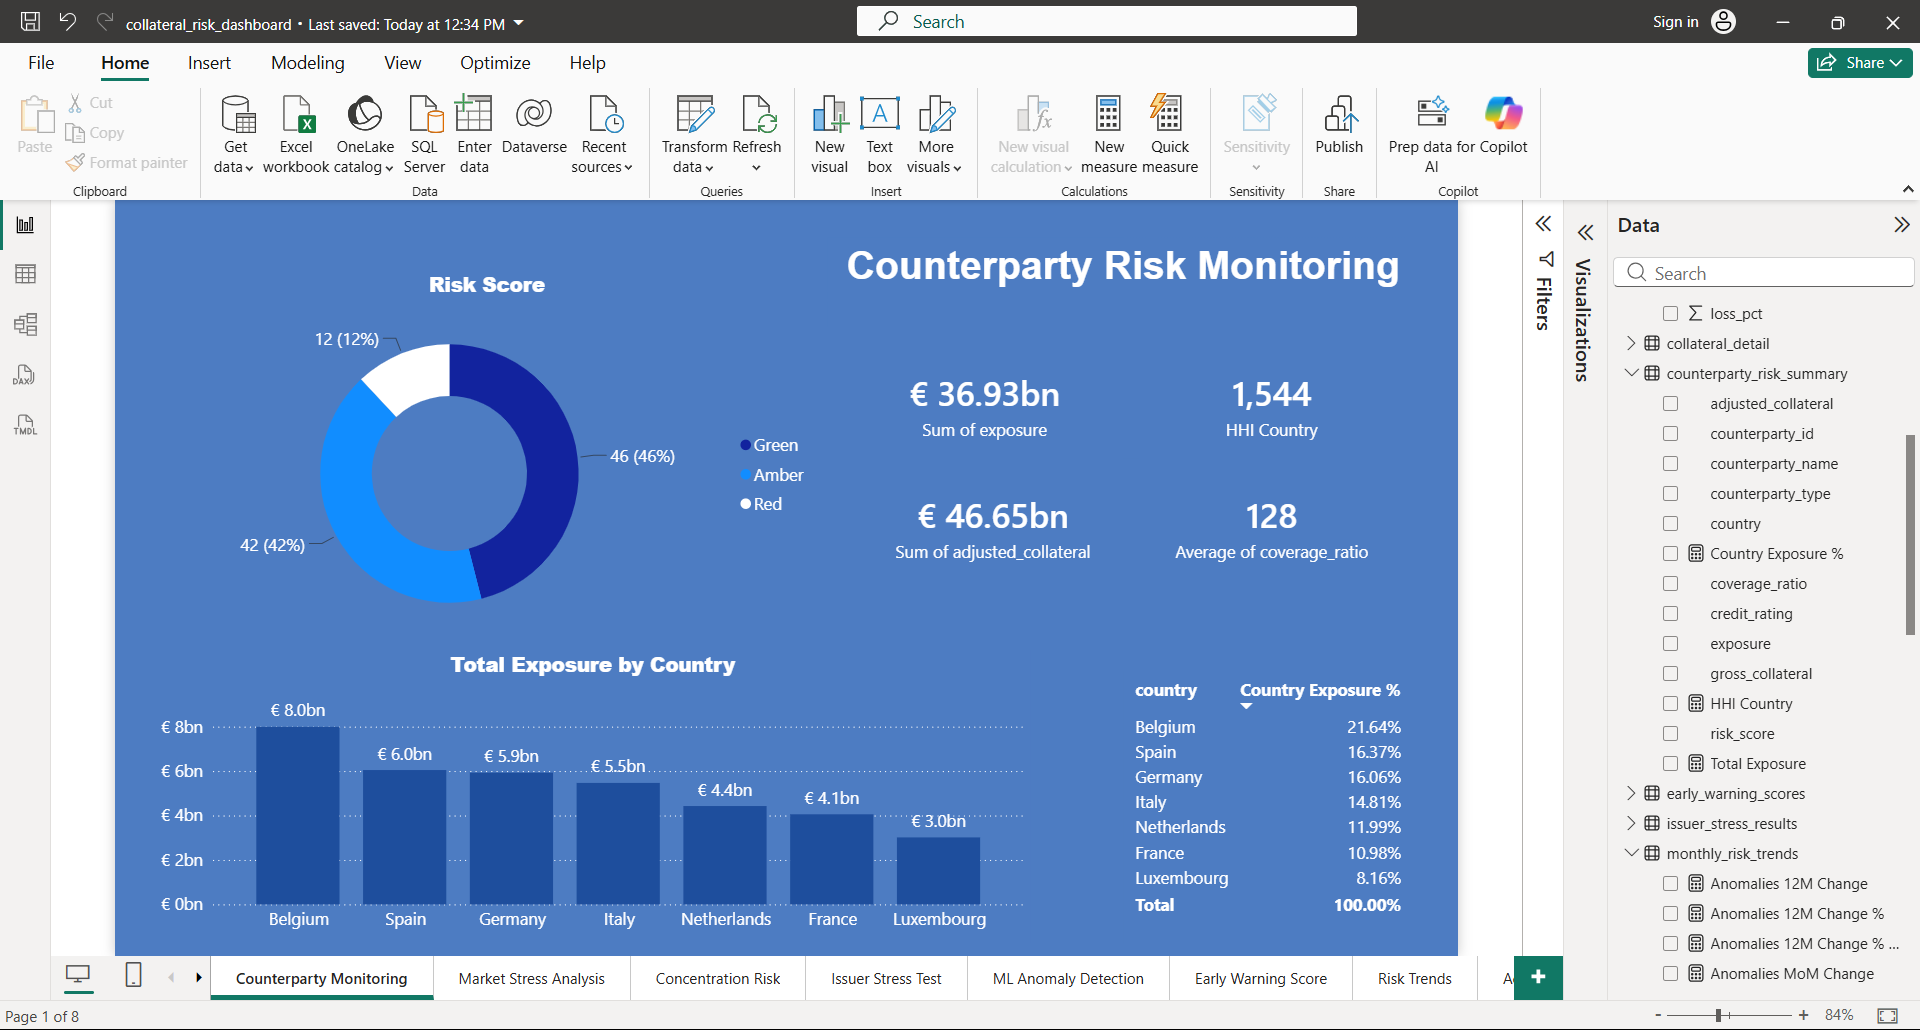
1. Portfolio Overview
Total exposure amounts to EUR 36.93bn, supported by EUR 46.65bn of haircut-adjusted collateral.
The average collateral coverage ratio is 128.02%, indicating adequate collateralization.
Current counterparty risk distribution is: Green: 46, Amber: 42, Red: 12.
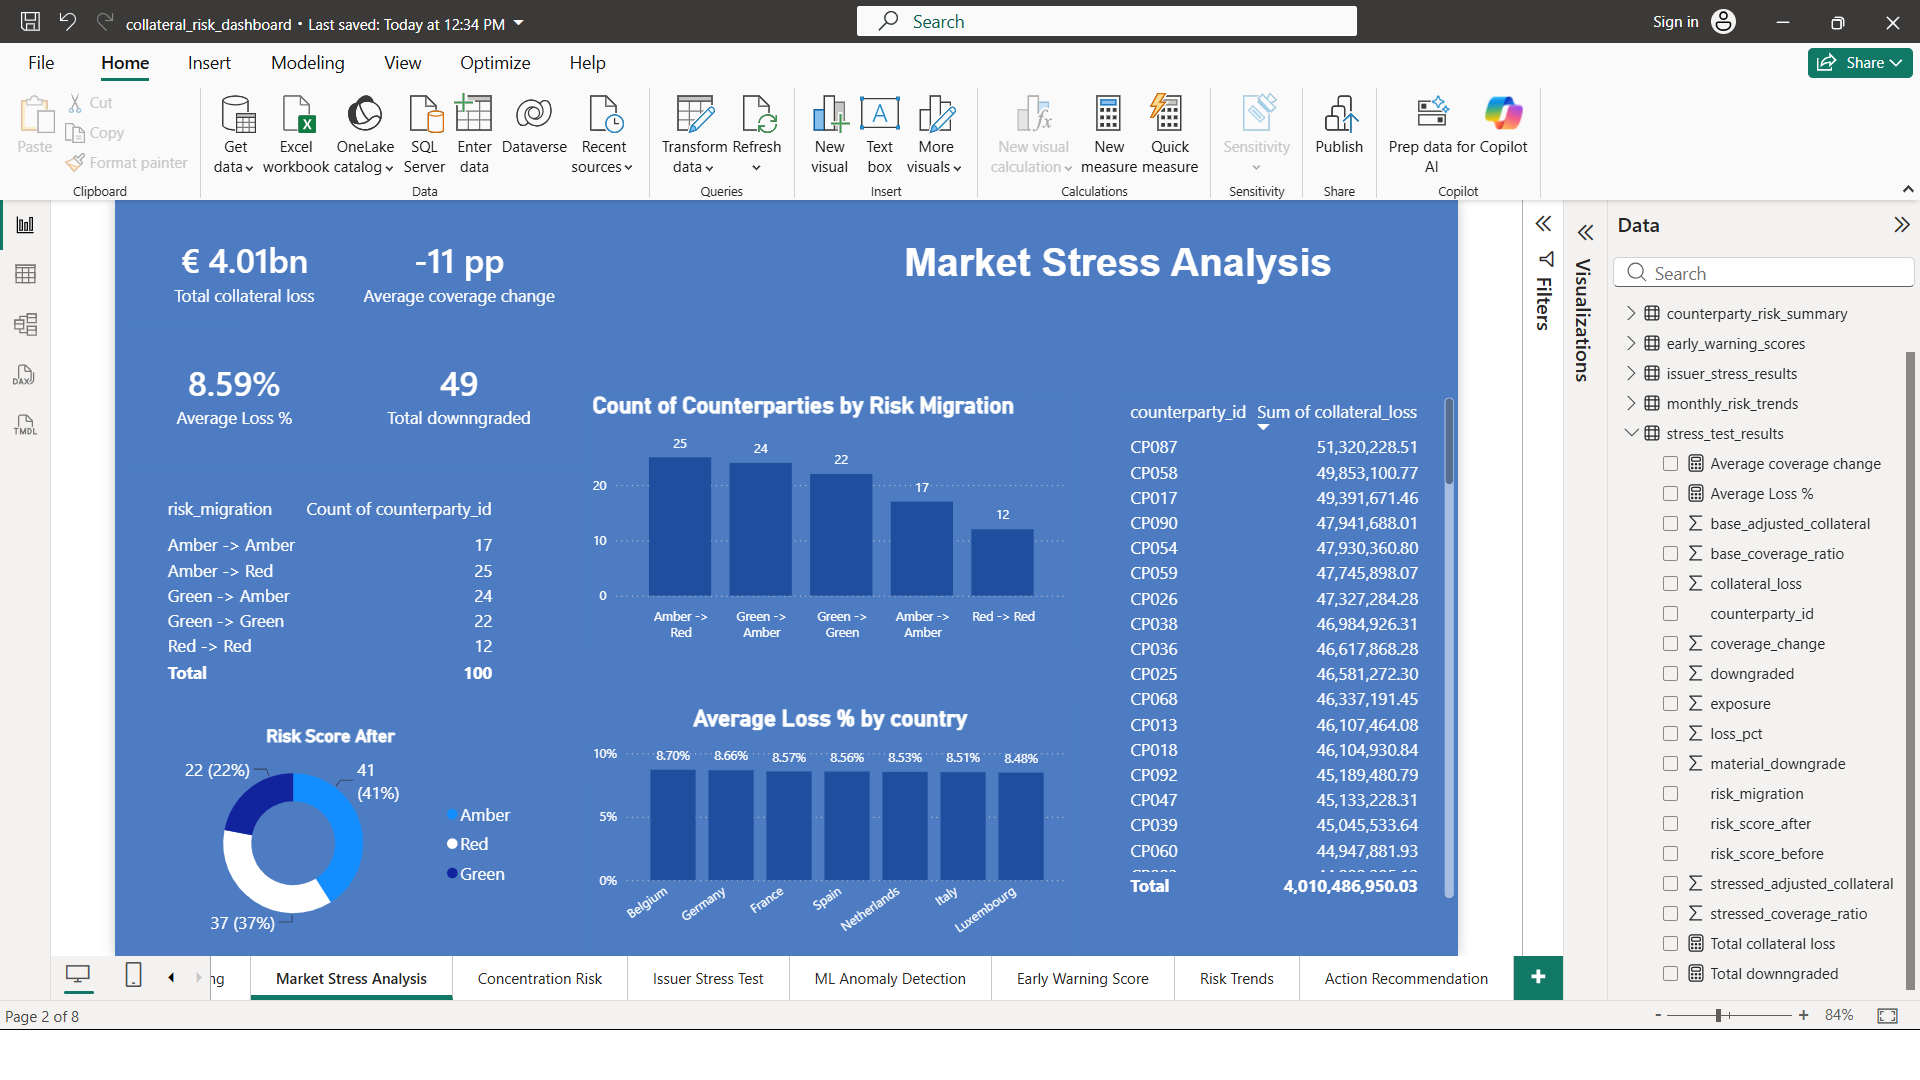
2. Market Stress Testing
Under the market-wide stress scenario, total collateral loss is estimated at EUR 4.01bn.
The scenario results in 49 counterparty downgrades, indicating elevated stress sensitivity.
Average coverage ratio deterioration is -11.00 percentage points.
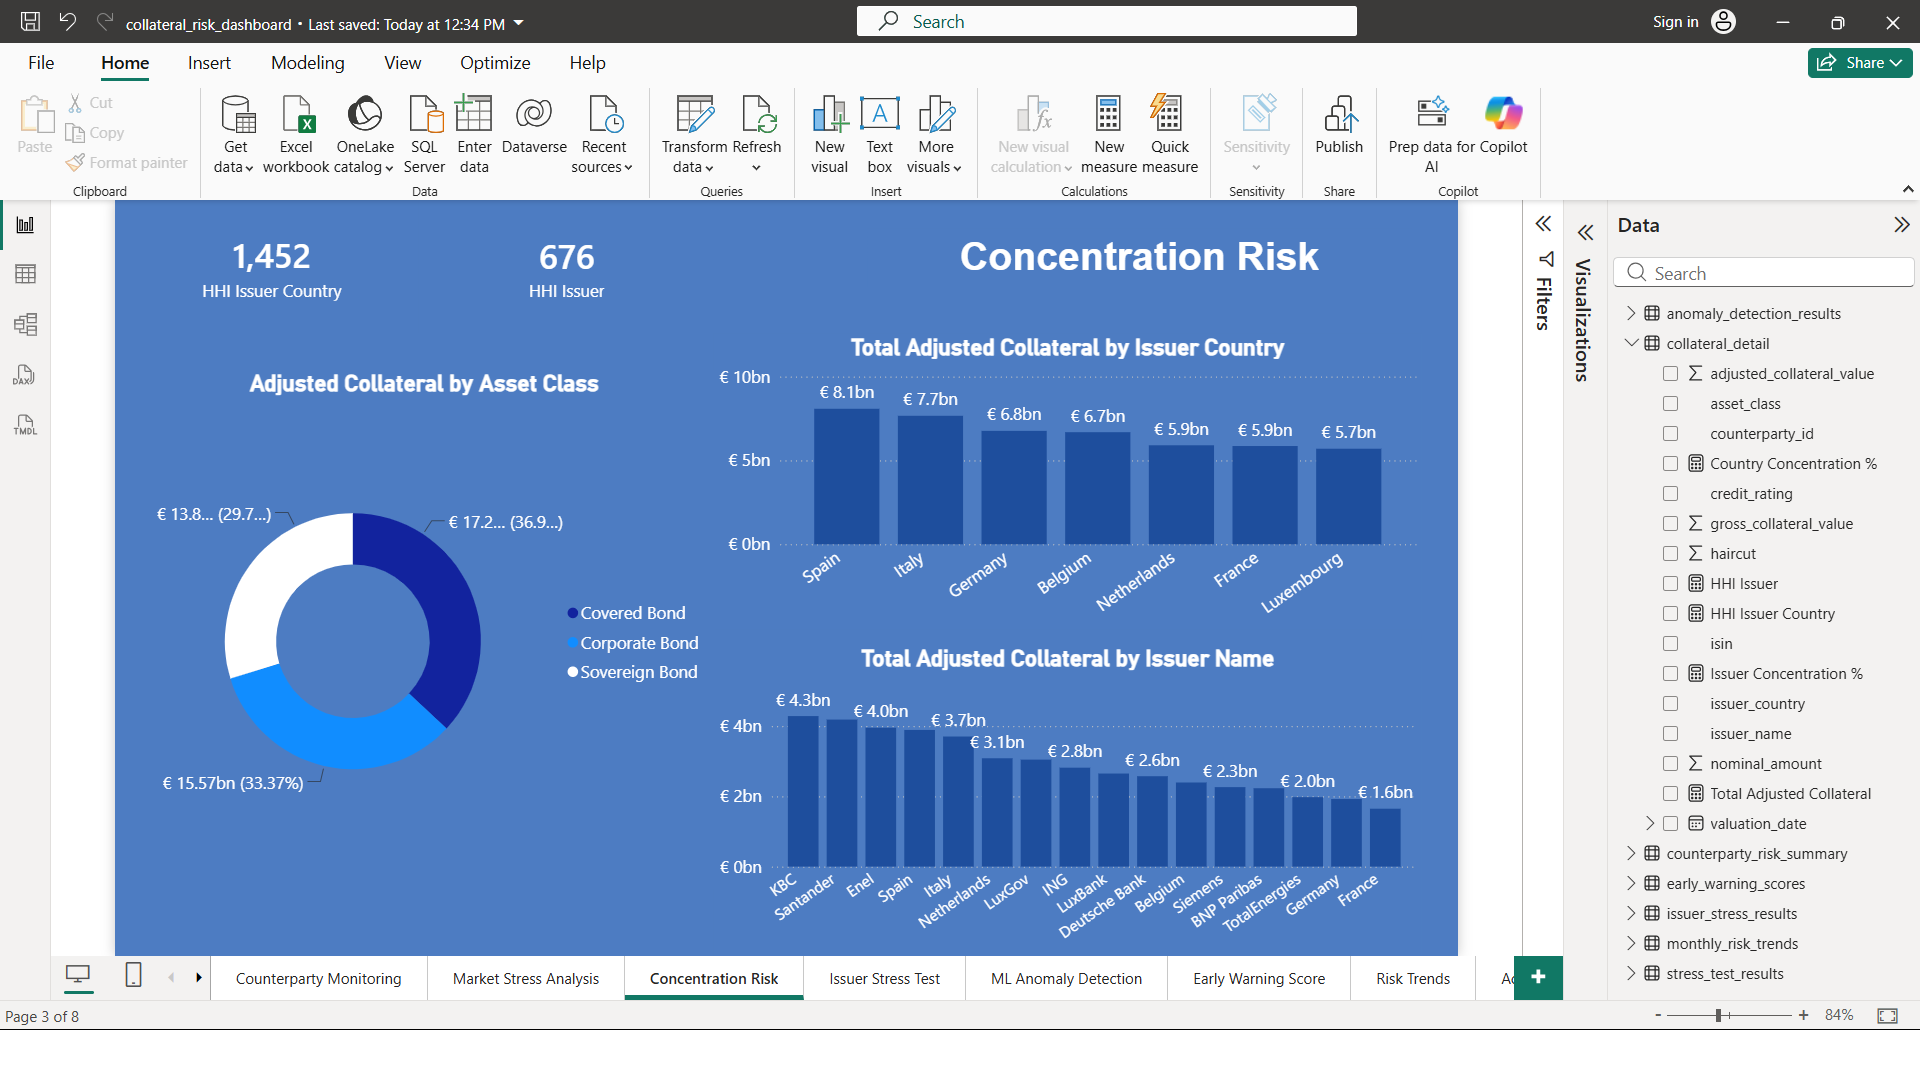
3. Concentration Risk
Country concentration HHI is 1450, indicating moderate concentration.
Issuer concentration HHI is 676, indicating low concentration.
These indicators are used to assess whether collateral exposure is overly dependent on specific countries or issuers.
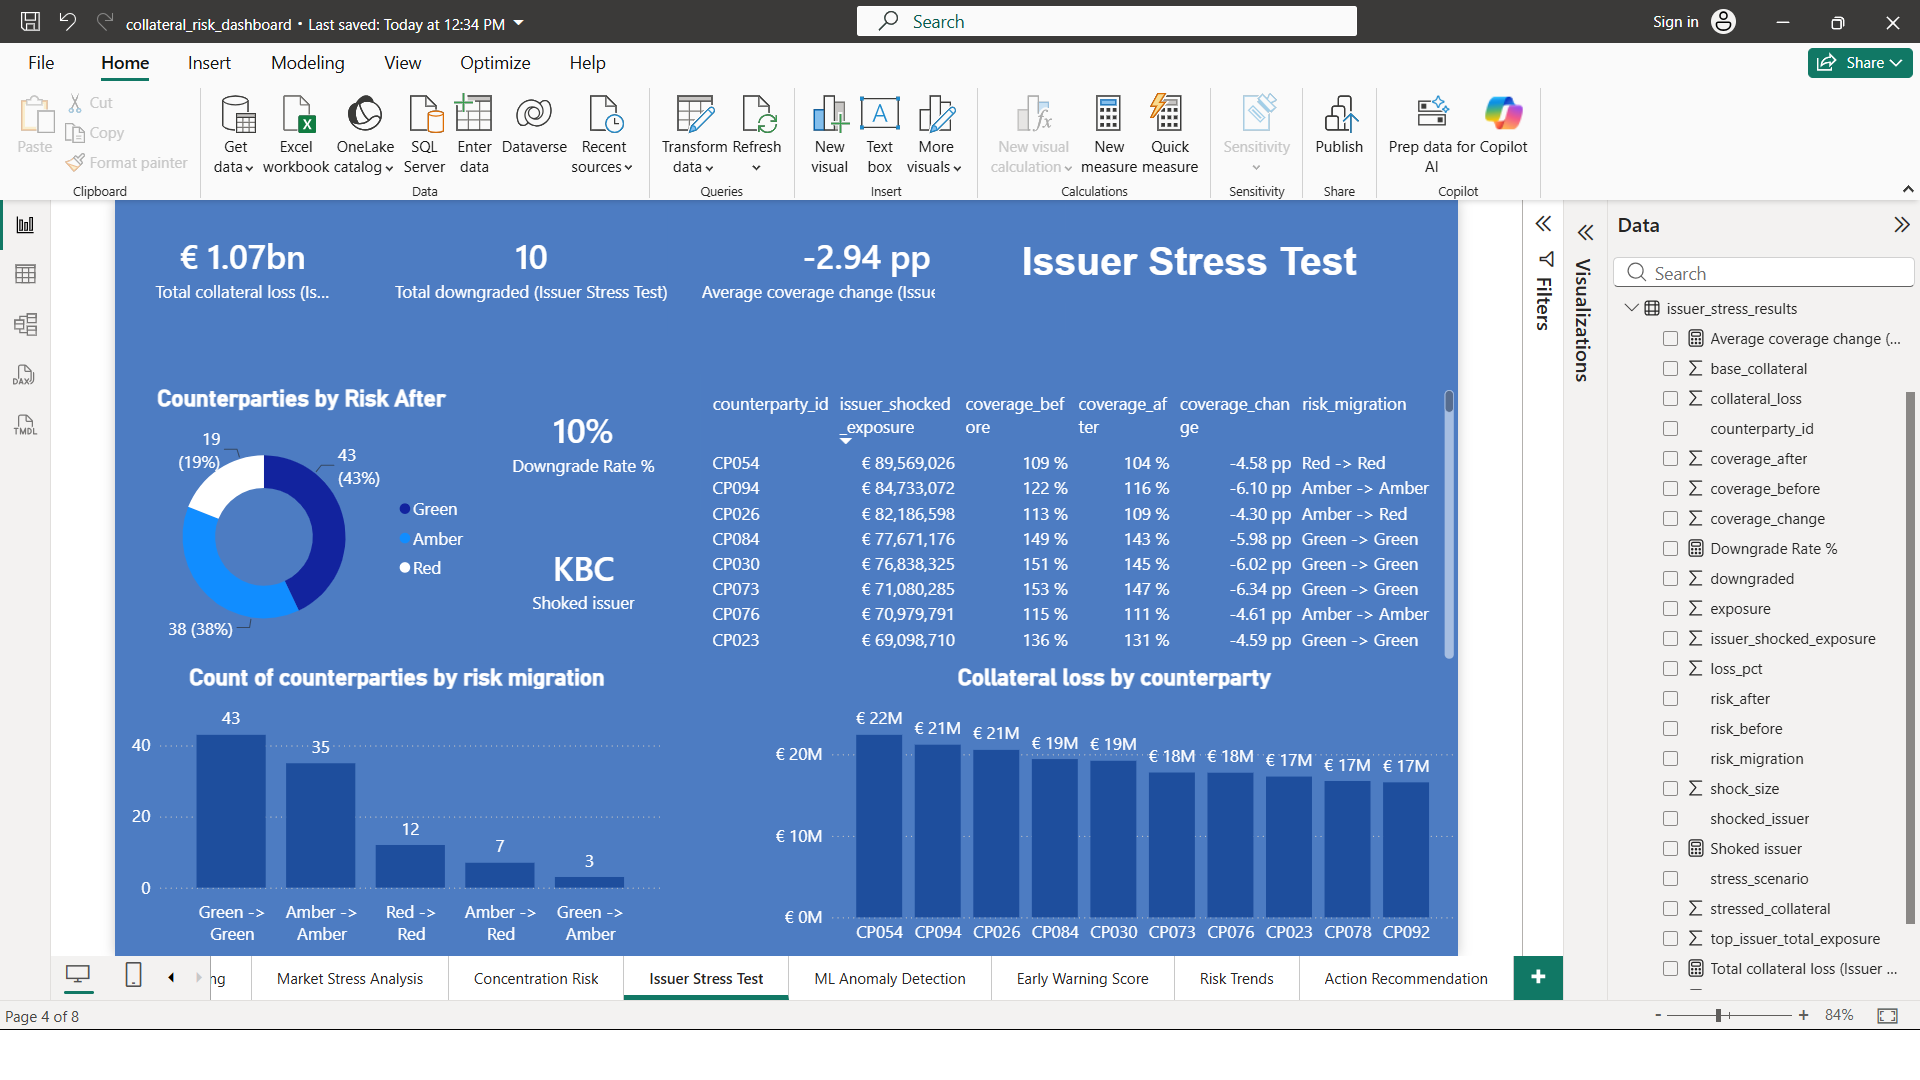
4. Issuer Concentration Stress
The largest issuer identified in the collateral portfolio is KBC.
A targeted issuer shock results in collateral losses of EUR 1.07bn and 10 counterparty downgrades.
This indicates moderate stress sensitivity to a single-issuer event.
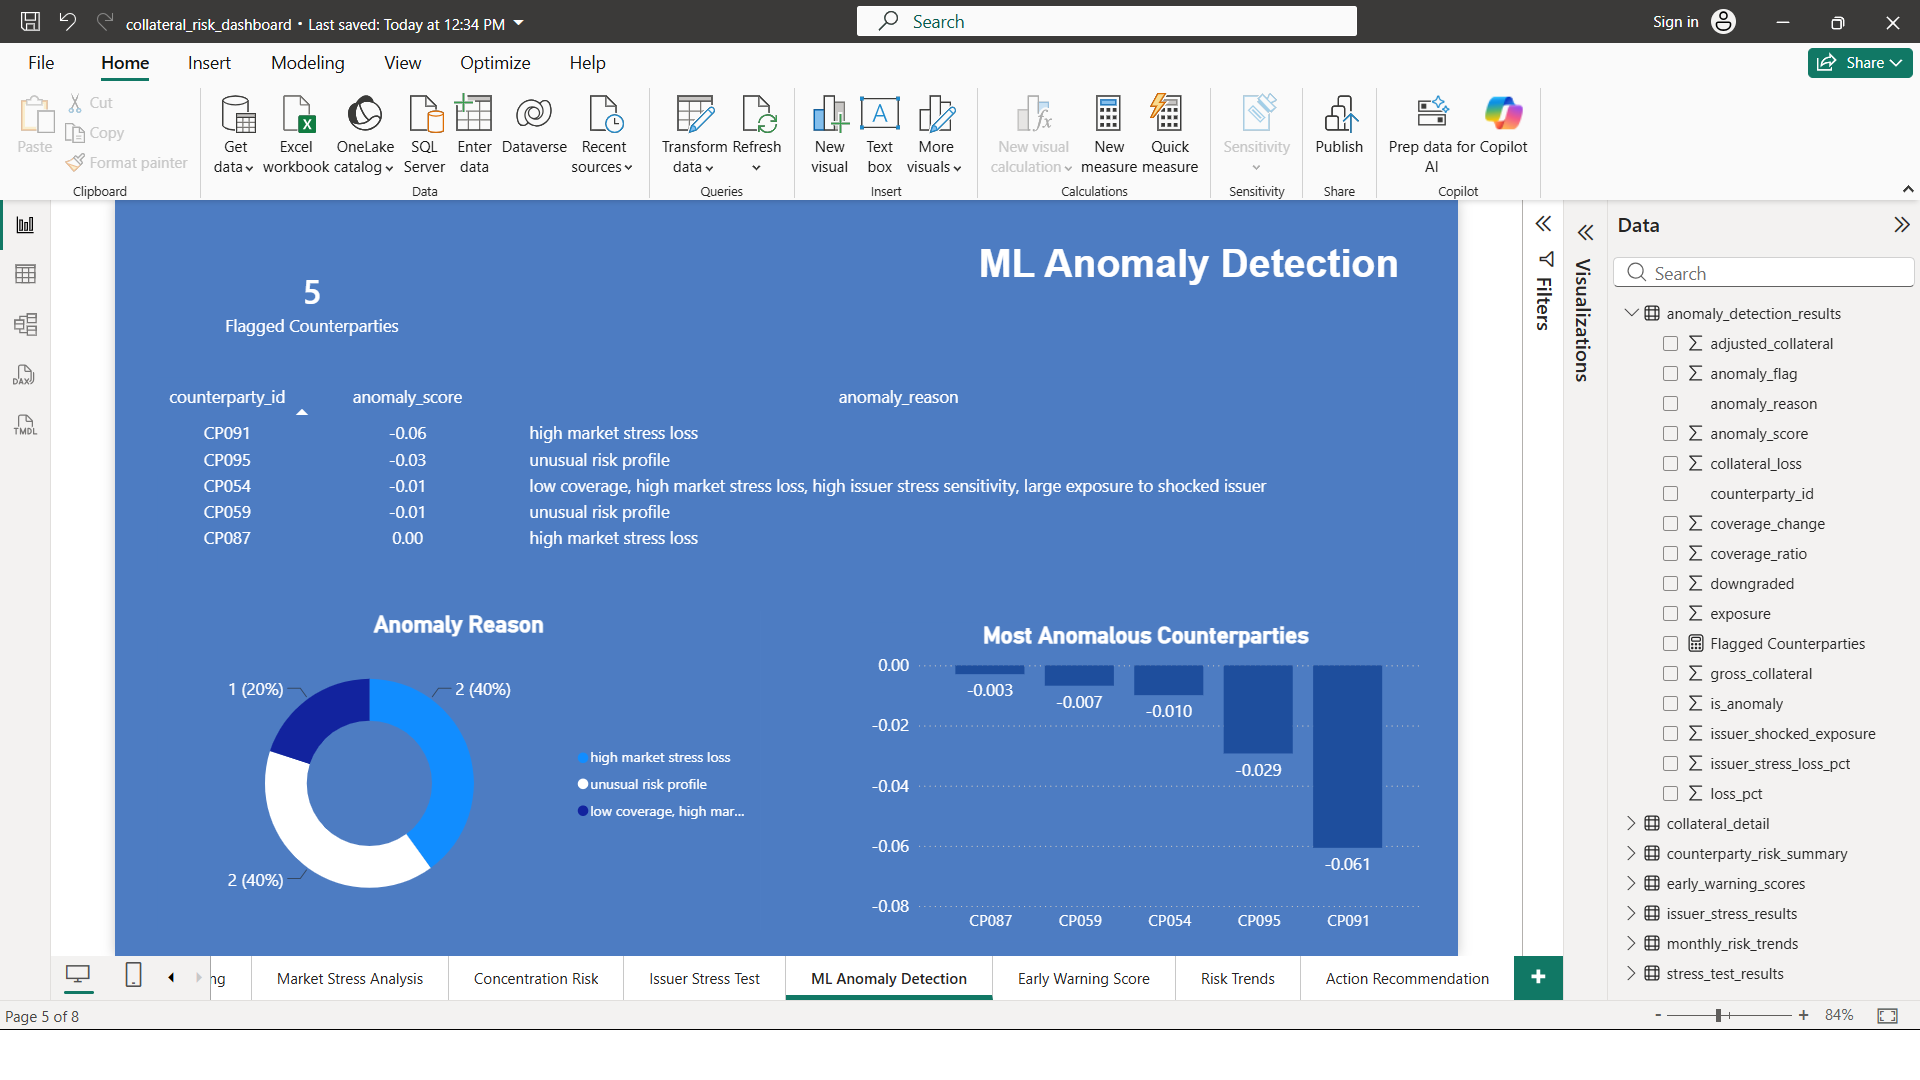
5. AI / ML Monitoring
The anomaly detection model identified 5 counterparties with unusual risk profiles.
A limited number of counterparties require additional review.
Top anomalous counterparties:
- CP091: high market stress loss (score: -0.06)
- CP095: unusual risk profile (score: -0.03)
- CP054: low coverage, high market stress loss, high issuer stress sensitivity, large exposure to shocked issuer (score: -0.01)
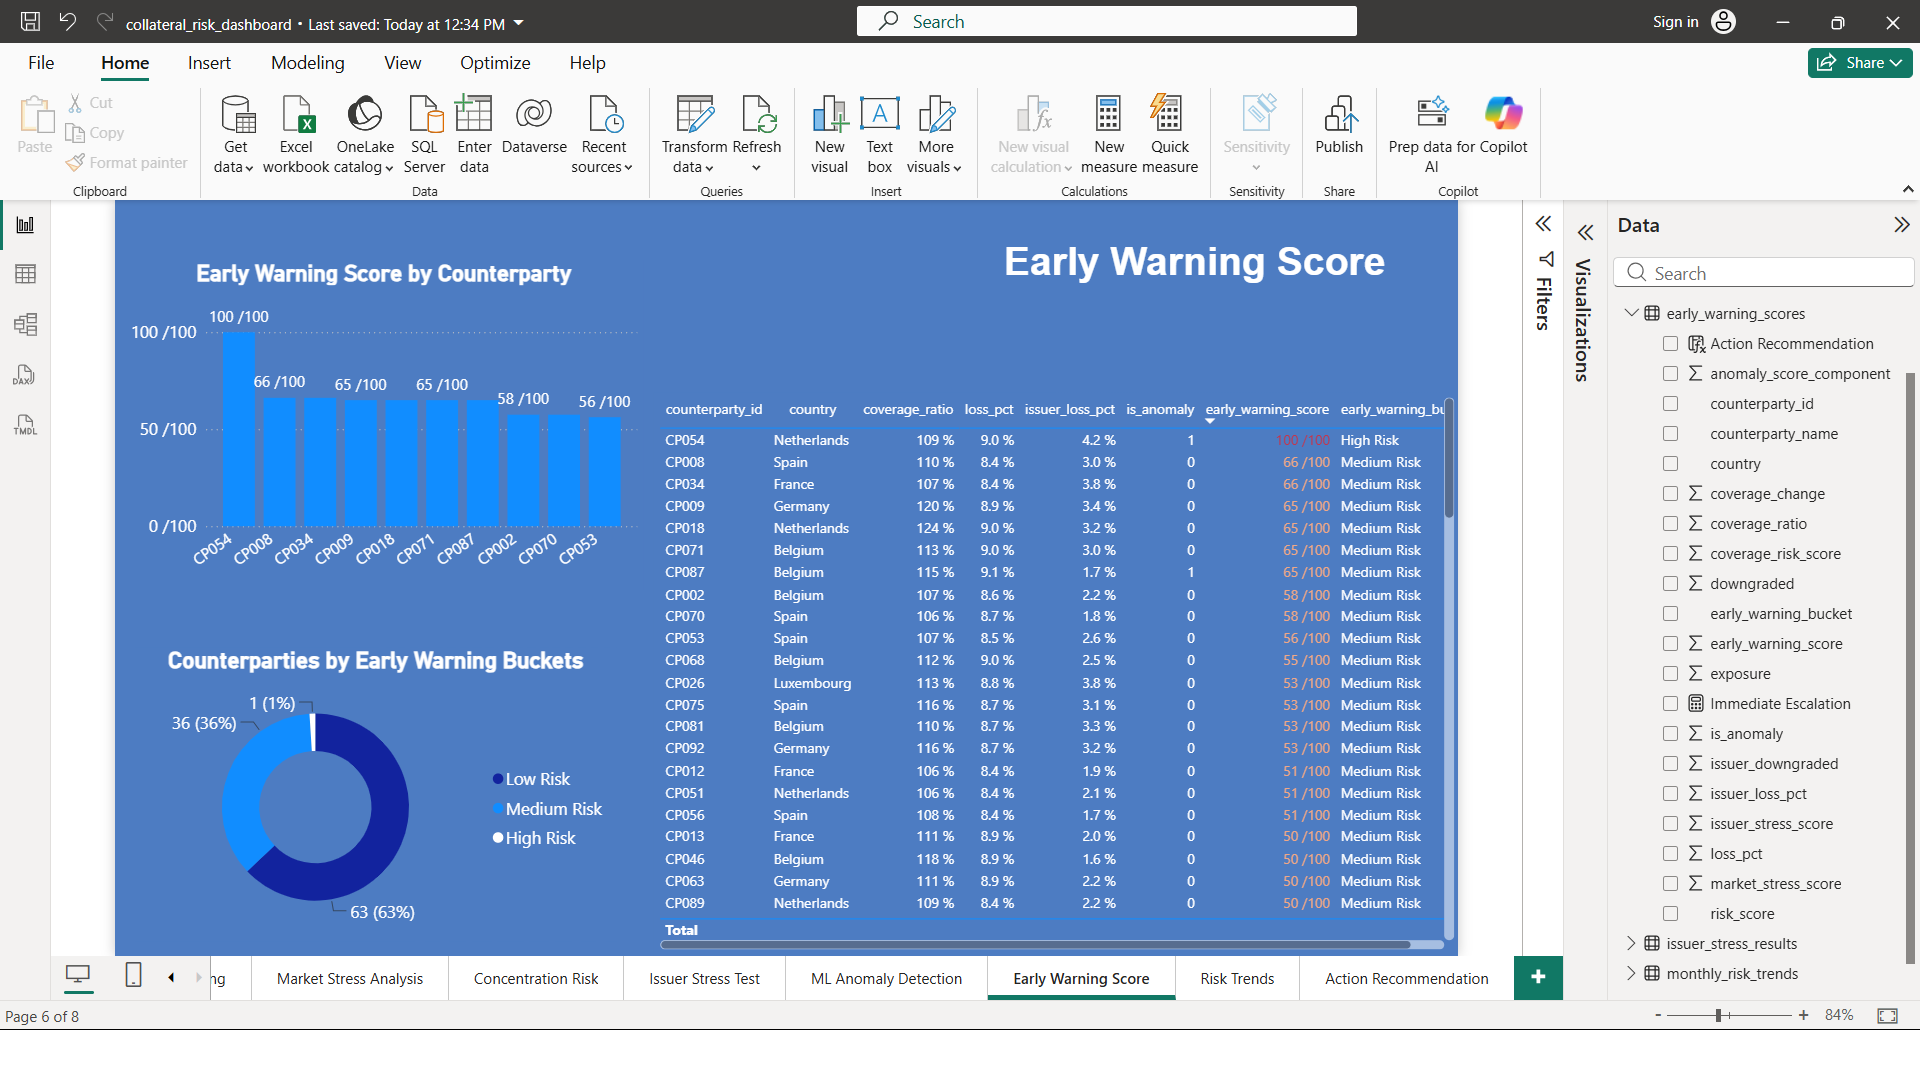
6. Early Warning Monitoring
The average Early Warning Score is 33.62, indicating low portfolio risk.
The current Early Warning distribution is: Low Risk: 63, Medium Risk: 36, High Risk: 1.
The maximum Early Warning Score is 100.00.
Top watchlist counterparties:
- CP054: EWS 100.0, High Risk, coverage 108.88%
- CP034: EWS 66.2, Medium Risk, coverage 106.99%
- CP008: EWS 66.2, Medium Risk, coverage 109.91%
- CP071: EWS 65.0, Medium Risk, coverage 113.42%
- CP018: EWS 65.0, Medium Risk, coverage 123.85%
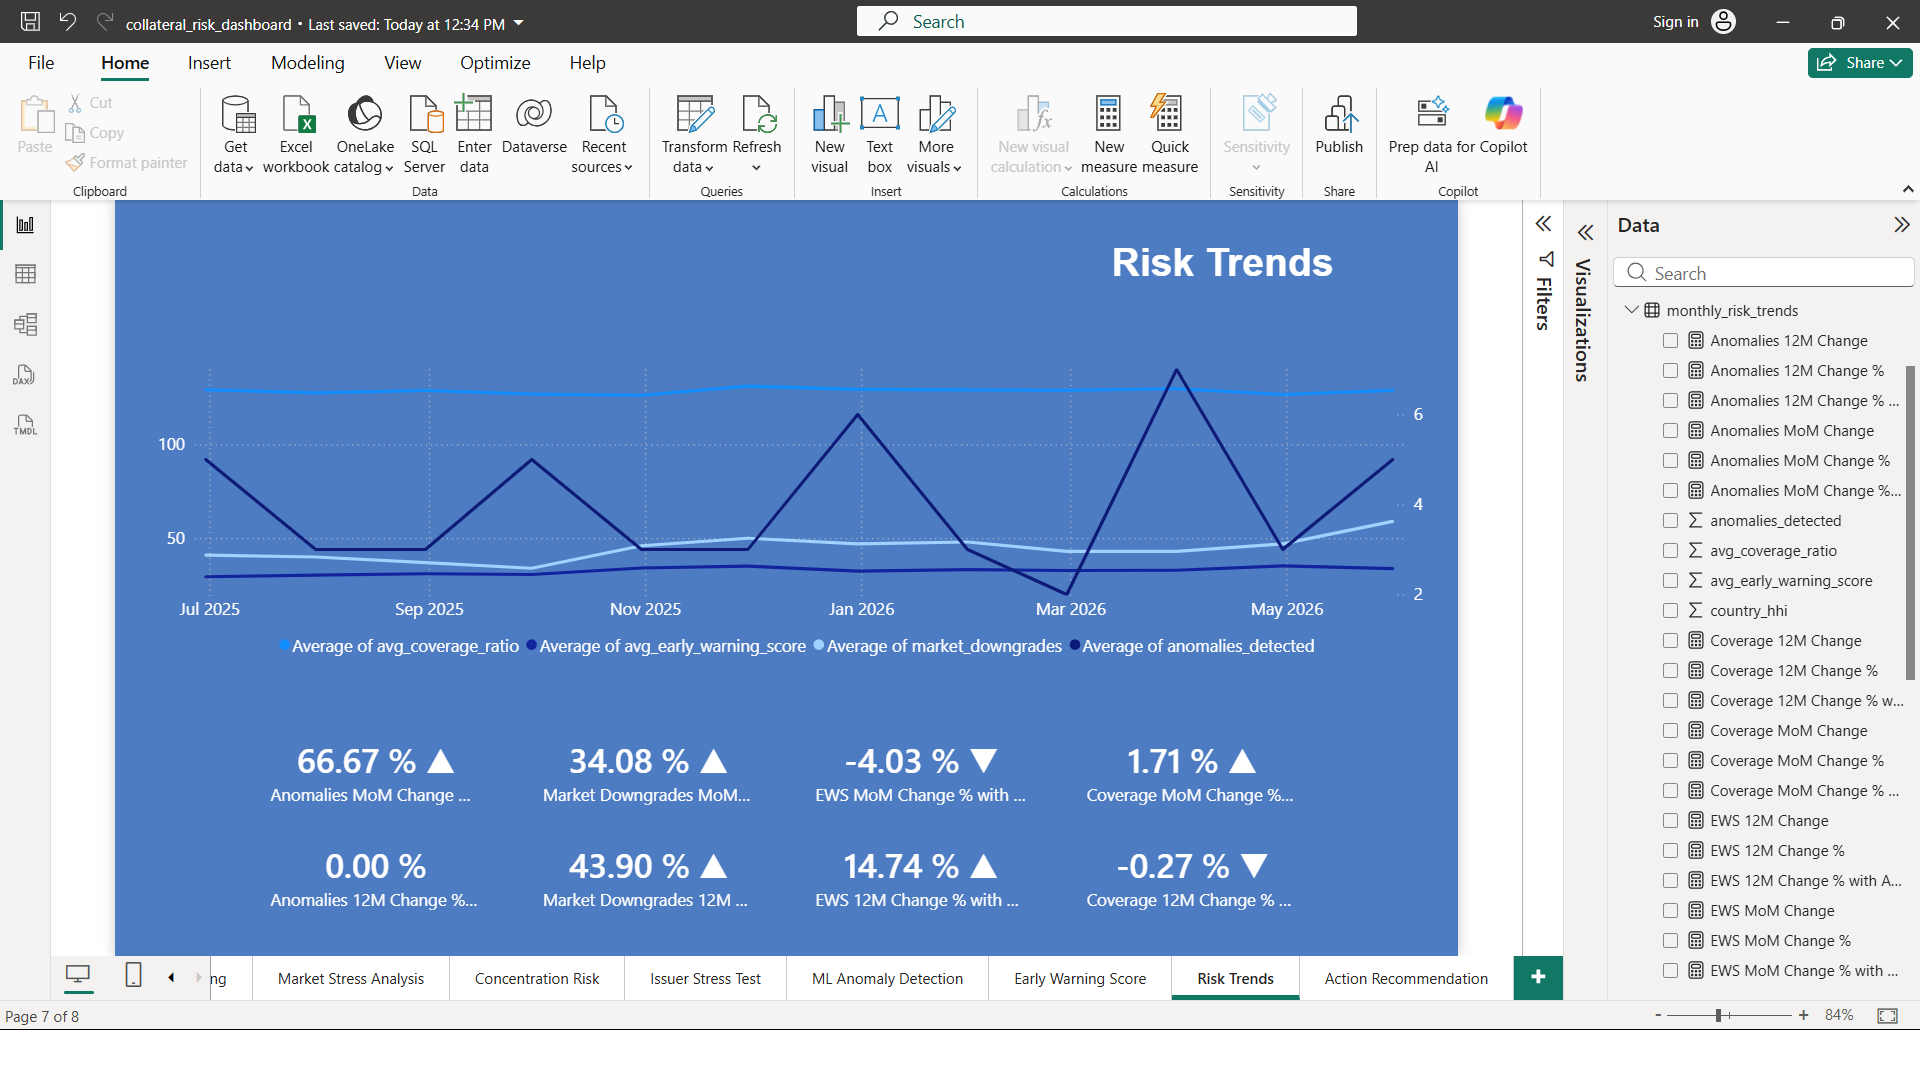
7. Risk Trend Analysis
Over the 12-month simulated monitoring period, the average coverage ratio deteriorated by -0.35 percentage points.
The average Early Warning Score deteriorated by 4.34 points.
Market stress downgrades deteriorated by 18 counterparties.
Detected anomalies remained stable by 0 counterparties.
8. Executive Conclusion
The portfolio remains broadly monitored through collateral coverage, stress testing, concentration analysis, issuer-specific stress, ML anomaly detection, and Early Warning Score indicators.
Key monitoring areas include: market-wide stress produces a material number of counterparty downgrades; the ML monitoring layer identified counterparties requiring review; the Early Warning Score framework identified high-risk counterparties.
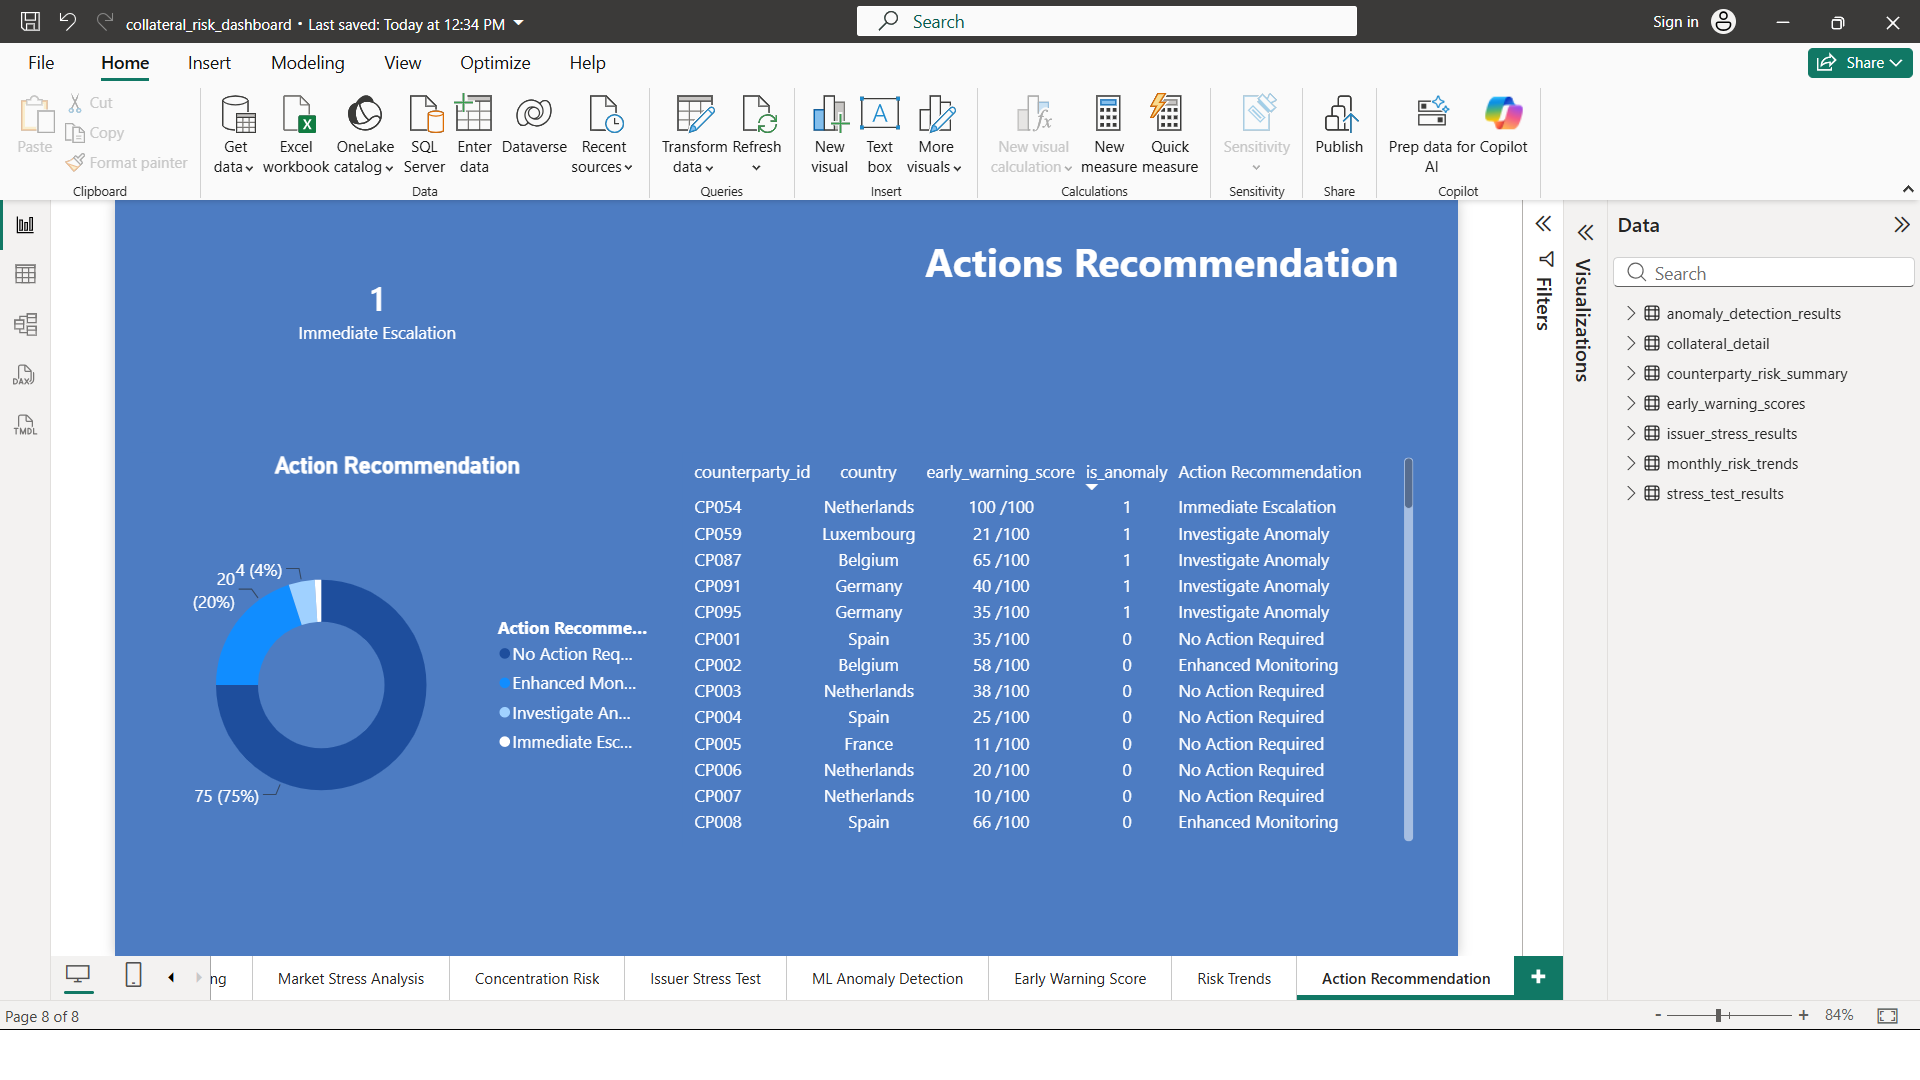
9. Recommended Actions
1. Review 1 counterparty/counterparties classified as High Risk by the Early Warning Score framework.
2. Monitor 36 Medium Risk counterparties for potential deterioration in coverage or stress sensitivity.
3. Review collateral buffers for counterparties downgraded under the market-wide stress scenario.
4. Assess counterparties most exposed to KBC, as the issuer-specific stress scenario generated material downgrades.
5. Investigate 5 anomalous counterparties identified by the ML monitoring framework.Future enhancements may incorporate Large Language Models (LLMs) to generate context-aware supervisory narratives and management reporting.
GitHub Repository
The repository includes Python engines, generated synthetic datasets, analytical outputs, and project documentation. The complete Power BI file can be shared upon request.
View Project on GitHub